Selecting a Predictive Maintenance Use Case for Success
You’re Connected...Now What?
The complexity and proliferation of connected medical devices continue to drive service costs. In the last 50 years, various organizations have tried to address this problem by leveraging more asset data and compute power. However, for many organizations maintenance is still predominantly a reactive endeavor. As simple predictive solutions are becoming more commonplace, leading enterprises in digital are looking beyond predictive capabilities to prescriptive insights to advise maintenance functions on what assets and tasks to prioritize while supporting the development of strategies that effectively “right size” an organization’s approach to maintenance.
Organizations now have access to vast amounts of data and ideas for how to use that data continue to proliferate. The real challenge has become prioritizing which opportunities to pursue. We aim to offer a point of view on selecting use cases that will add value quickly while generating enough momentum to sustain an advanced analytics program.
We discuss how organizations are using advanced analytics and predictive maintenance to advise maintenance functions. Predictive maintenance (PdM) utilizes statistical, machine learning (ML) and artificial intelligence (AI) techniques to predict asset health issues before they arise. When successful, these predictive technologies can enable a prescriptive approach that balances the potential severity of a particular failure mode with an estimate of how likely that failure is to occur. This measure, commonly called “criticality”, empowers teams to focus their time and resources on the assets, systems and subsystems that are most critical to both patient and business outcomes.
Business Context and Benefits
The effective use of PdM strategies can help manufacturers realize benefits for key stakeholders of connected device utilization.
- Patients: Patients can experience higher levels of satisfaction due to increased clinical asset availability which allows them to receive more timely treatment.
- Clinicians: This same increased clinical asset availability may enable clinicians to improve their clinical throughput which in turn may allow them to treat more patients and may reduce the payback periods associated with investment in connected devices.
- Manufacturers: Manufacturers may benefit from reduced mean time to repair (MTTR) and improved first-time fix rates (FTFR) which may further decrease the non-value-added “windshield time” associated with field service requests.
These potential benefits make a compelling case for organizations that wish to improve their maintenance operations and routines by leveraging data from connected assets, but the question remains “how do we start?”
“Value-First” Prioritization Strategy
It may be tempting to begin to collect and store every data point that is available to an organization. However, undirected data collection can result in high levels of activity with few measurable results. To protect against this common pitfall, we will offer a framework for a “value-first” prioritization strategy that will help guide interested parties.
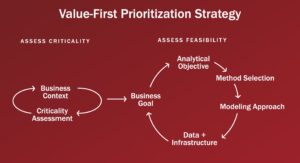
Figure 1: Value-First Prioritization Strategy
Organizations should engage in an iterative approach that aims to assess the criticality of a use case in its business context. Such an assessment can be used to rank order opportunities by the value that they represent. High-value targets should then be assessed for feasibility to ensure that resources are dedicated to use cases that have a high probability of success. More specifically organizations should:
- Identify high-value opportunities based on the criticality of the failure mode
- Frame use cases in terms of value-driven business goal and an analytical objective
- Use that analytical objective to assess the feasibility of the use case
- Select an analytical method and modeling approach that support the target objective
Identifying High-value Opportunities: Measuring Use Cases for “Criticality”
Unsuitable use cases can consume valuable time and resources. To protect the resources of their reliability teams, organizations should work backward from ideal business outcomes to identify high-value opportunities for improvement. When thinking of predictive maintenance, it’s important to articulate the business value associated with predicting (and subsequently preventing) a particular failure mode and to determine if the effort/cost of predicting this failure mode is economically attractive.
Collecting several use cases and then ranking them by a directional “criticality” measure can help teams prioritize opportunities that are most likely to result in a meaningful organizational impact. While there are many ways to think of criticality, we have converged on the simplified measure outlined in the figure below.
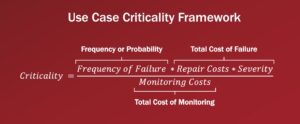
Figure 2: Use Case Criticality Framework
Teams should focus on finding an approachable and repeatable way to assign some indication of criticality to each of their use cases so that opportunities can be rank ordered and prioritized.
Retaining information about the elements that make up this criticality measure may enable teams to further refine their maintenance strategy even when a PdM approach is not warranted. Plotting each use case by the Frequency of Failure vs the Total Cost of Failure allows teams to consider how a variety of maintenance strategies may be leveraged (an example of such a plot is shown below).
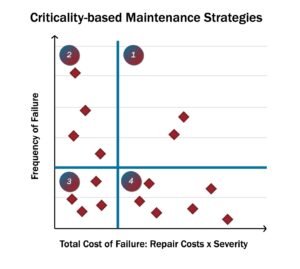
Figure 3: Criticality-based Maintenance Strategies
Dividing this plot into quadrants highlights:
- Quadrant 1: frequently occurring, high-cost failure modes. These are prime targets for PdM strategies coupled with contingency planning.
- Quadrant 2: failure modes that occur frequently but are low cost. These are likely strong candidates for preventative maintenance strategies.
- Quadrant 3: both low cost and low frequency—may warrant only corrective maintenance interventions (run to failure).
- Quadrant 4: high-costs failure modes that occur relatively infrequently. The cost associated with such a failure may warrant predictive or preventative maintenance strategies.
Investing enough time to assess criticality and determine if a given use case is a strong candidate for predictive maintenance up front can help teams ensure that they are using the right toolset for a given opportunity before the cost of applying that toolset has been incurred.
Framing Use Cases in Terms of Business Value and an Analytical Objective:
It’s worth highlighting that effective use cases should be clearly tied back to a value proposition that is meaningful to the organization and its stakeholders. Usually, strong use cases will make an appeal back to the kinds of the benefits that we highlighted at the opening of this article.
However, a more sophisticated use case articulates its value by making an appeal to asset economics. Example: Reduce the number of superfluous, maintenance-related field service requests by X% by right sizing power-supply and battery-related maintenance strategies for ‘device A’, which will save $Y per device per year.
Ensuring that use cases are framed in terms of business value will make it easier to assess the criticality of a given failure mode.
Once business value has been clearly defined, articulating economically attractive use cases in terms of an analytical objective will make it easier for teams to assess the feasibility of a contemplated opportunity. With this analytical objective in hand, the team is ready to assess how feasible their use case is given their stated objective.
Assessing Use Cases for Feasibility
Determining the feasibility of a use case is an iterative process. Once a business problem is well understood and its criticality assessed, we recommend tracing the logic of the business goal all the way through method selection and data and infrastructure feasibility. The figure below offers a visual representation of this process. At each step, teams may uncover information that will require them to re-evaluate the previous steps that they have completed. For example, they may discover that they lack sufficient data to leverage a classification algorithm. In such a situation, the team may opt to restate its analytical objective in a way that better suits the data that are available (focusing on anomaly detection for example). Reframing the opportunity in this way does not represent a failure, but rather serves to guide teams toward the analytical methods and modeling approaches that best fit the system’s current level of maturity.
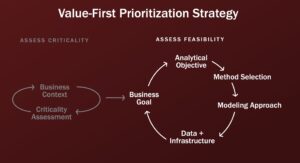
Figure 4: Assessing Use Case Feasibility for Prioritization
Reframing challenges/opportunities also allows teams to localize their analytical objective to the appropriate level of granularity. Objectives may deal with defining outcomes at the system, sub-system, or component level. Understanding how these levels interact with one another will facilitate the kind of analytical thinking that is necessary to deliver the value of a particular use case. A vital component to an organization’s success is the selection of the right use case(s) relative to their position on the path to a “right-sized” maintenance practice.
Analytical Method Selection and Modeling Approach
Following the iterative approach above, teams should take their analytical objective and begin to explore the methods and models that best support it. While not exhaustive, the following flow chart offers some preliminary structure to this process.
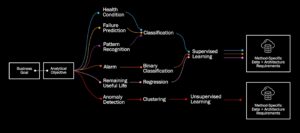
Figure 5: Predictive Maintenance Outcome to Method Mapping
Starting with the desired outcome of the analytical objective, teams can select an appropriate “problem type” which will, in turn, direct them to an appropriate modelling approach. For example, teams that are looking to build alarm-based systems which trigger an intervention when the probability of failure reaches a certain threshold will likely be drawn to binary classification methods. There are several modelling approaches available (logistic regression, tree-based methods, support vector classification machines, etc.) The details of each of these approaches can be used to assess the viability of the model given the available data, etc.
While each predictive maintenance outcome has different data and infrastructure requirements, as seen below, the machine learning model development steps are fundamentally the same. These steps focus primarily on the initial model deployment. There are several resources available to those who want to explore what more mature MLOps structures may look like.

Figure 6: Machine Learning Model Development Steps
Data Management
Do I have enough data to support the method I've selected?
Establishing a clear data management strategy is critical. Development efforts will often stall when collected data are unusable, due to either erroneous and untimely collection or formatting complexity, which leads to more work afterward to adjust sensors and software. The longer predictive capabilities take to calibrate, the slower teams will be able to generate value through their implementations.
Assuming just the data is sufficient for data scientists to be successful without providing business context, value case development and subject matter expertise can lead to organizations having a lot of data, but no valuable insights. This can lead to several cycles of rework and project overruns in order to gain necessary understanding of system and business processes. Keep in mind, learning from data and adjusting predictive approaches is a continuous process. Managing data is a practice unto itself. Data management and data governance are important supporting activities that allow data science teams to operate. Our colleagues have compiled some leading practices that can help organizations deliver trustworthy data.
We recommend the following set of questions to help you evaluate how robust the data you have are relative to your analytical needs:
- What systems/subsystems are linked to the failure mode at the core of my use case?
- What impact does this failure mode have on the overall system and/or related subsystems?
- What subassemblies, components, or parts are involved in this failure?
- Have I successfully determined the root cause of this failure?
- What measurement/sensing information do I have localized to key subassemblies, components, or parts?
- Are my measurement methods robust enough to detect relevant failure signals? Can they do so far enough in advance for an intervention to be useful?
- Am I collecting the data that I need? (Consider the breadth, depth, and granularity of data capture)
- What transformations and/or additional data sources will be necessary to provide me with the data that I need to approach this use case?
- Do I have the necessary data (in the necessary format) to apply my selected PdM method?
Conclusion
Establishing a predictive maintenance (PdM) practice may appear to be a daunting undertaking. Organizations that wish to take advantage of the promise of advanced analytics would do well to focus on high-value use cases as proofs of concept that allow their teams to build skill and familiarity in the space.
To accomplish this, prioritizing use cases based on criticality and then assessing use case feasibility can help teams select the most promising use cases for their own PdM pilots. At Kalypso we have a storied history of partnering with organizations to overcome the challenges that many face as they engage in their own digital transformation.


