
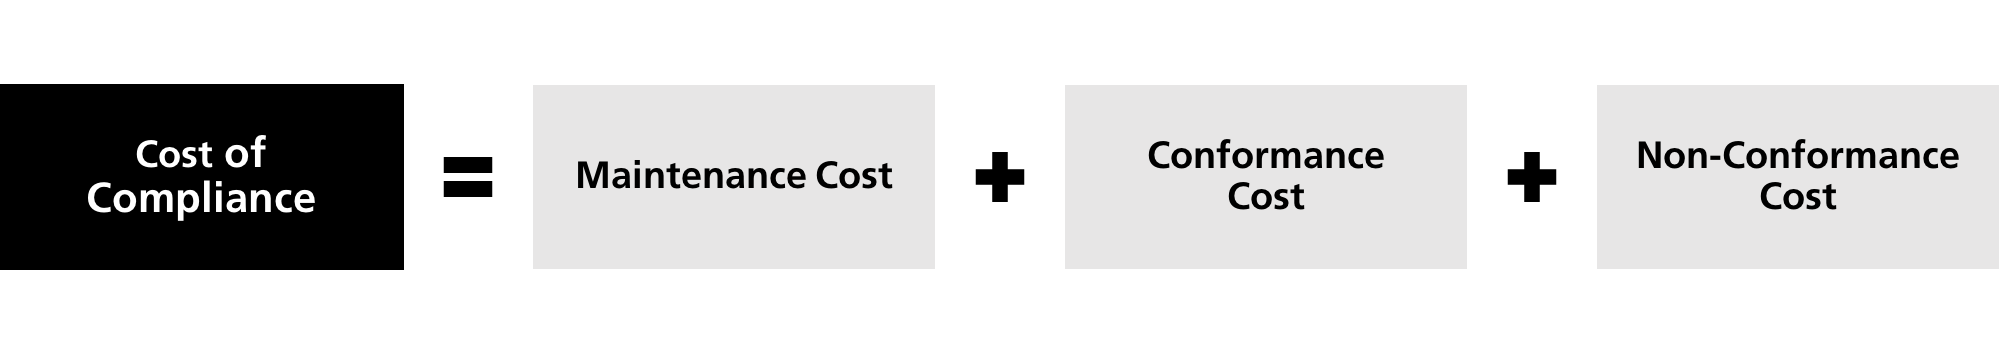
F&B Compliance: Maintenance and the Cost of Non-Conformance
In Understanding the Cost of Compliance: A Framework, we outlined a framework for organizations to understand how much they’re spending on regulatory compliance and whether that investment is sufficient and effectively allocated. In Anticipating Regulation & the Cost to Conform we more deeply explored the Conformance Cost category of the framework. Now, we will discuss the Maintenance and Non-Conformance categories.
Maintenance Cost
If Conformance costs are viewed as “staying in business”, Maintenance costs are “keeping the doors open”. Maintenance costs are expenditures by the business to maintain compliance with regulations that are already in effect. The two most significant sub-categories in this area are:
- Verification
- Supplier evaluation
Verification costs are driven by the size and effectiveness of an organization’s regulatory group. Verification activities are the day-to-day work that regulatory employees perform to ensure products are legal, safe and fit for purpose. Examples are regulatory approvals on labels or artwork, product testing in the plant to ensure regulatory content and limits are accurate and all the effort required to achieve regulatory “sign off” before shipping a product. Verification costs can be estimated by allocating a percentage of the direct labor costs associated with the regulatory workforce to these types of activities.
Supplier evaluation activities also fall within the Maintenance Cost category. Large Food & Beverage organizations invest significant resources into ensuring their suppliers are meeting their needs from a regulatory perspective. Consider Nestle, who currently has 165,000 suppliers and audits thousands of them each year3. To understand investment in supplier evaluation, businesses must know how many audits are being performed and how many of those audits are performed by third parties, as the cost of a third-party auditor will significantly exceed that of an internal auditor.
In totality, we expect roughly 30% of a company’s expenses on compliance to be related to maintenance costs, primarily driven by expenditures on the regulatory workforce who keep the company compliant with current regulations.
Non-Conformance Cost
The most commonly recognized cost in an organization’s total Cost of Conformance is non-conformance cost. These costs manifest themselves in the form of recalls (including fines and fees) when product must be removed from the market. As we previously pointed out in Understanding the Cost of Compliance: A Framework, the average recall costs an organization $10 million per incident1. However, not all recalls are “average” and recent research shows that the cost of a very large recall can range between $40-60 million2. A highly publicized and drawn-out affair, Conagra’s 2007 peanut butter recall far exceeded the upper bound of this range, accumulating a total of $85 million in direct recall and litigation costs. This is in addition to tens of millions in required updates to the plant2.
Non-conformance cost can be the largest of all three expense categories if an organization is not effectively meeting regulatory requirements. Leading organizations invest above the industry average in areas of verification and supplier evaluation to keep recall costs low. Our research and experience also indicates that investments in the training sub-category can have a positive impact on a reduction in non-conformance costs.
The industry has seen a recent uptick in recalls, largely attributed to increased scrutiny from regulatory bodies, better detection methods and more media coverage of these types of events. This trend is expected to continue. Avoiding recalls is critical, and organizations must invest in the Maintenance and Conformance cost categories to keep their Non-Conformance costs low.
Conclusion & Recommendation
The Cost of Compliance Framework is a starting point for organizations to expand their understanding of annual expenditures related to regulatory compliance. As businesses shift their view of regulatory compliance from recalls and fines to a more comprehensive set of regulatory activities, they can identify trends that allow for real improvements and returns on regulatory-related investment. Also, the collective CoC is not always housed and controlled under the same function and budgetary oversight, which is why the framework is key; it pulls all potentially disparate pieces together and provides a comprehensive understanding of the full compliance investment, allowing improvements to be made.
Completion of this analysis, particularly when paired with an industry benchmark, can shape decision making on regulatory compliance investment. It can help F&B Quality and Compliance leaders address critical questions – “Do I have sufficient regulatory staff?”, “Am I investing enough in my regulatory systems?”, “Where can I further invest to reduce the likelihood of recalls?”. Questions like this cannot be answered in a vacuum, and what the CoC framework provides is the guidance on the balancing act that must be played between conformance, maintenance, and non-conformance costs. Companies that are able to use their data to not only ensure sufficient investment, but also avoid over-investment in compliance, will be those that can sustain a competitive advantage.
Works Cited
3. Watrous, Monica. General Mills investing more in food safety. Food Business News. April 14, 2017.
Authors

